Address 304 North Cardinal St. Dorchester Center, MA 02124
Work Hours Monday to Friday: 7AM - 7PM Weekend: 10AM - 5PM
Business Intelligence & Data Solutions
Are your executives flying blind?
In mid-market companies, growth outpaces infrastructure. Your management team shouldn’t be waiting until the 15th of the month just to see last month’s sales figures. Right now, your analysts are likely spending up to 40 hours a week manually downloading CSVs, copy-pasting data between legacy Excel files, and chasing down broken formulas.
When your commercial data is fragmented across disconnected CRMs, ERPs, and spreadsheets, decision-making becomes slow, reactive, and prone to human error. You lose sight of your true margins.
NUMU changes that. We transform your fragmented data into a single, automated source of truth.
Engineered for Executive Clarity
Executive Scorecards
High-level, real-time tracking of daily revenue, gross margins, and cash flow designed for the CEO to view at a glance.
Operational & COGS Dashboards
Deep-dive analytics into supply chain costs, inventory movement, and localized discount structures to protect your true operational profitability.
Sales Pipeline & CRM Trackers
Dynamic visualizations for your Sales Director to monitor win/loss ratios, individual rep performance, and pipeline health.
Advanced Excel Upgrades
We transform clunky, manual legacy spreadsheets into fast, automated operational models using Power Query and advanced Excel architecture.
Production Power BI Portfolios
Explore high-resolution screens and run the operational models we deploy for corporate and mid-market leaders. Click “Launch Live Portal” to experience an interactive mock dashboard simulator on actual client data feeds.
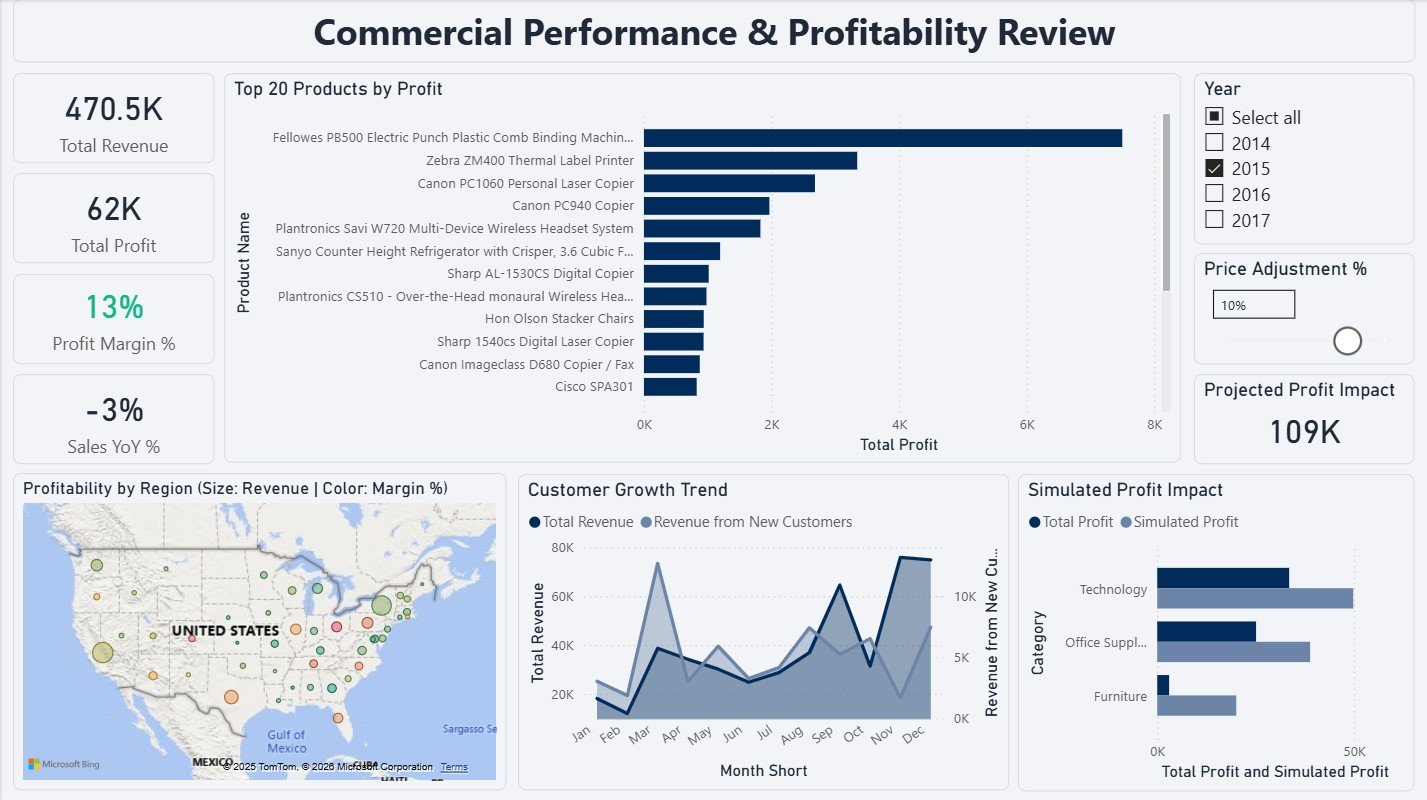
Designed for private equity-backed distribution forces. Connects inventory ship logs with pipeline CRM data to reveal underpriced accounts and model profitability adjustments in real-time.
Top 20 products gross contribution review
Interactive price scenario simulation
Regional profitability bubble heat map
Multi-Regional Operations Console
Adventure Works Commercial Executive Suite
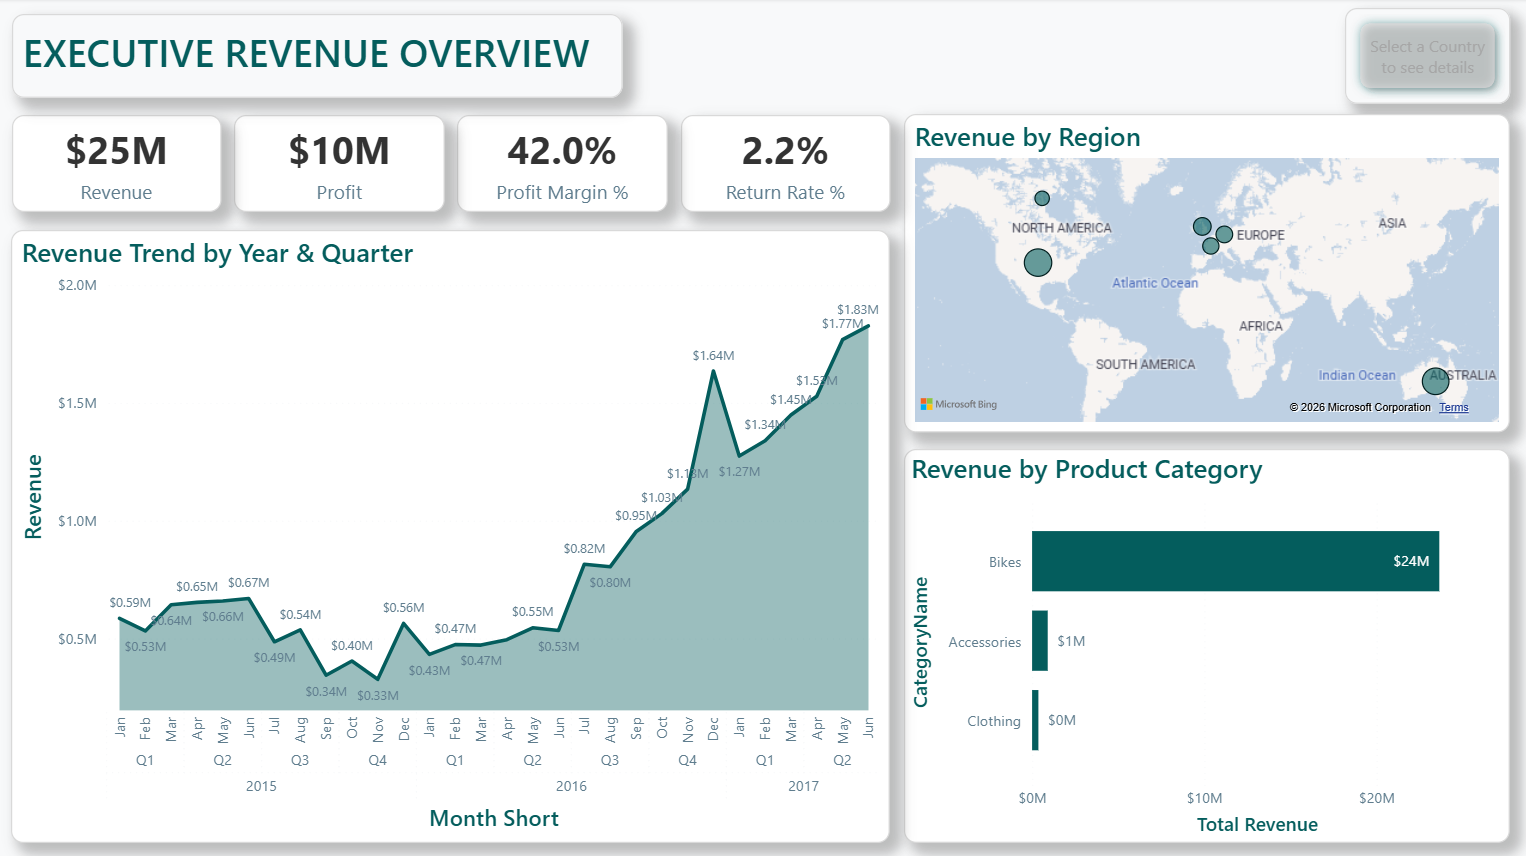
A multi-tab corporate command center integrating multinational sales ledgers and client profiles. Translates raw retail databases into quick, role-based visual decisions in seconds.
Interactive revenue trend historical logs
Global geographic business bubble map
Customer detail with low margin alerts
Freight & Cargo Cost Intelligence
Global Logistics Operations & Profitability Engine
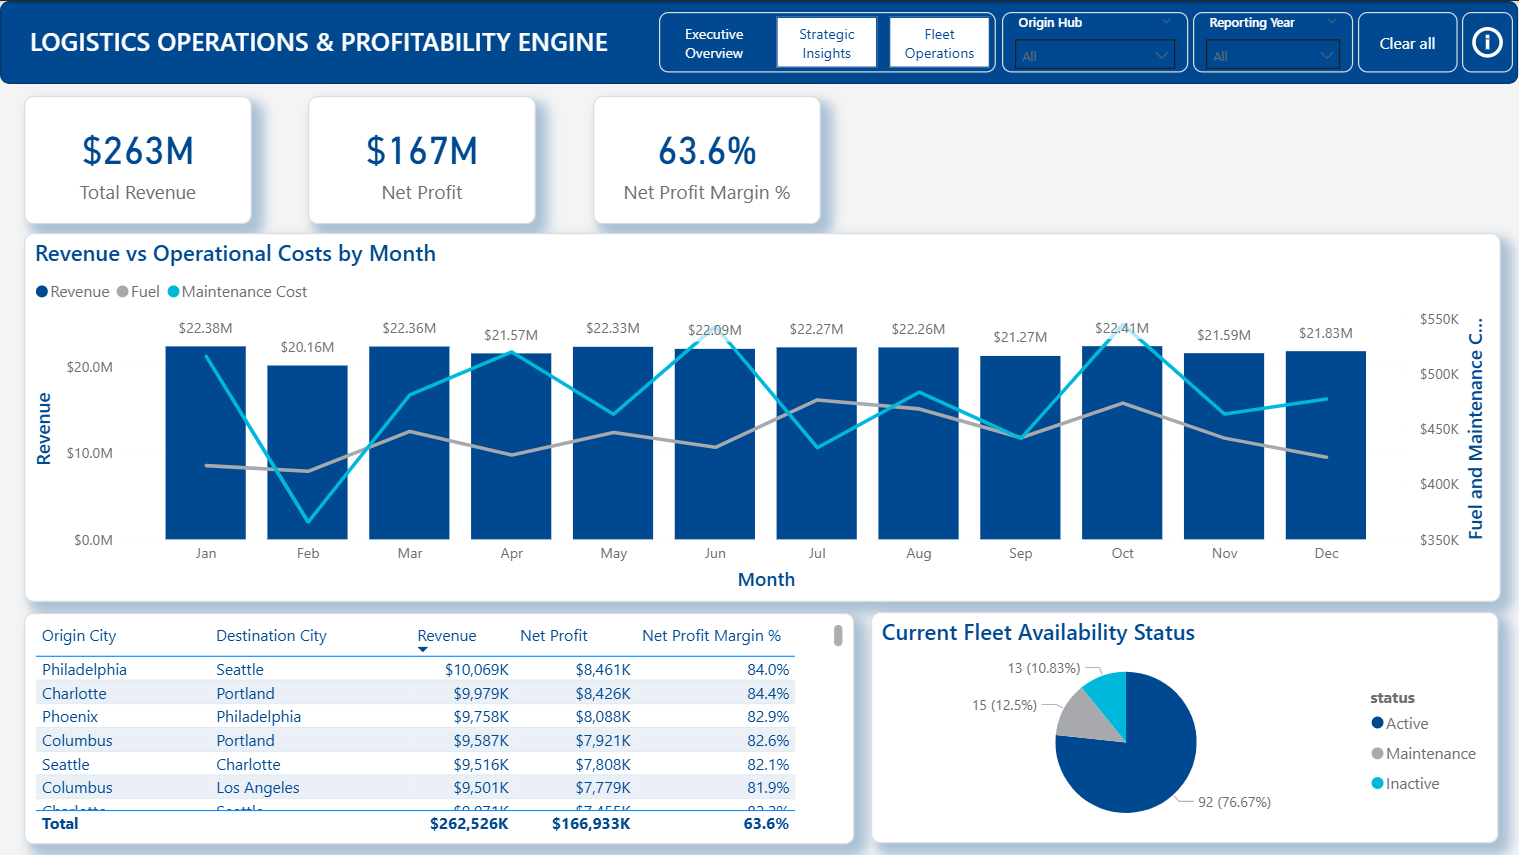
A dynamic supply chain analytics dashboard mapping cargo volumes, fuel burn ratios, and maintenance logs. Connects heavy telematics to recover hidden third-party carriage margins.
Revenue vs. operating costs monthly trends
Detailed route and hub profitability grid
Fleet health and maintenance lifecycle audit
From Raw Data to Real-Time Action
Data Audit
We map out your current data ecosystem, identifying bottlenecks, silos, and manual Excel processes.
Architecture
We consolidate your ERP and CRM data, building robust models using Power Query to establish a single reliable source of truth.
Deployment
We design and publish interactive Power BI dashboards that automatically refresh—eliminating manual work entirely.
Handover
We don’t hold your data hostage. We train your internal team using your actual business data to maintain the system independently.
The Financial Impact of Total Visibility
Automate Commercial Reporting
Recover hundreds of administrative hours per
Zero Human Error
Automated data pipelines mean no more broken formulas or miscalculated margins.
Agile Decision Making
Shift from analyzing what happened last month to predicting what will happen next week.
Ready to upgrade your commercial architecture?
Partner with NUMU to eliminate administrative bottlenecks, upgrade your commercial architecture, and turn complex market dynamics into measurable financial growth.